Pandas DataFrame hist() Method
To get the summarized data in a visual representation, we use the histogram and in this tutorial, we will learn the Python pandas DataFrame.hist() method. This method makes a histogram of the DataFrame’s. A histogram can be defined as the representation of the distribution of data. This method calls matplotlib.pyplot.hist(), on each series in the DataFrame, resulting in one histogram per column.
The below is the syntax of the DataFrame.hist() method.
Syntax
DataFrame.hist(column=None, by=None, grid=True, xlabelsize=None, xrot=None, ylabelsize=None, yrot=None, ax=None, sharex=False, sharey=False, figsize=None, layout=None, bins=10, backend=None, legend=False, **kwargs)
Some of the important parameters of DataFrame.hist() method are,
data: It is the DataFrame that the pandas object holding the data.
column: It represents the str or sequence. If this parameter is passed, it will be used to limit data to a subset of columns.
by: It represents the object, optional. If this parameter is passed, then used to form histograms for separate groups.
grid: It represents the bool(True or False), and the default is True. It indicates whether to show axis grid lines.
bins: It is the int or sequence, and the default value is 10 and it represents the number of histogram bins to be used. If we give an integer, bins + 1 bin edges are calculated and returned. If we give bins as a sequence, it gives bin edges, which includes the left edge of the first bin and the right edge of the last bin. In this case, bins are returned unmodified.
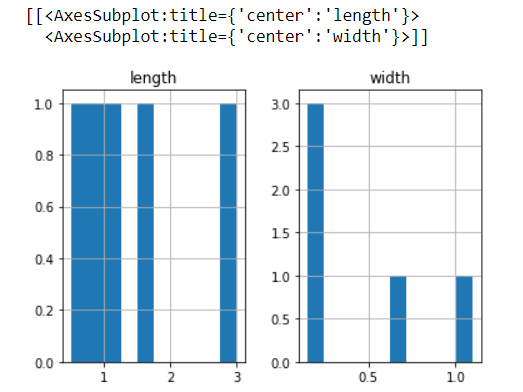
Example: Creating histograms of columns of the DataFrame using the DataFrame.hist() method
In the below example, we created a DataFrame, and let's apply the DataFrame.floordiv() method to the DataFrame and get the visual representation of the DataFrame. We will get the graph based on the DataFrame columns that are the length and width. See the below example.
#importing pandas as pd
import pandas as pd
df = pd.DataFrame({'length': [1.5, 0.5, 1.2, 0.9, 3],'width': [0.7, 0.2, 0.15, 0.2, 1.1]}, index=['python', 'C', 'C++', 'R', 'Pearl'])
print(df.hist())
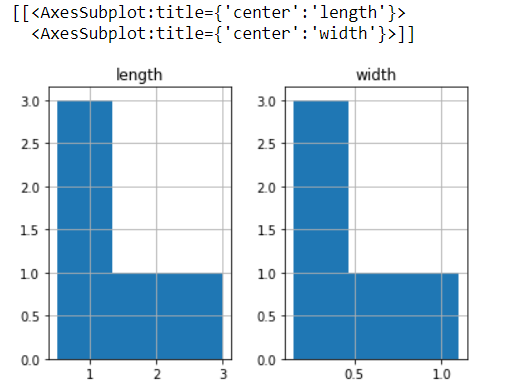
Example: Creating histograms of columns of the DataFrame using the DataFrame.hist() method with bins method.
The DataFrame.hist() method draws a histogram based on the length and width of some indexes, displayed in three bins. See the below example.
#importing pandas as pd
import pandas as pd
df = pd.DataFrame({'length': [1.5, 0.5, 1.2, 0.9, 3],'width': [0.7, 0.2, 0.15, 0.2, 1.1]},index=['python', 'C', 'C++', 'R', 'Pearl'])
print(df.hist(bins=3))
Example: Set column='length' in the DataFrame.hist() method
Here, we gave the column as length and the DataFrame.hist() method draws a histogram based on the specified column. See the below example.
#importing pandas as pd
import pandas as pd
df = pd.DataFrame({'length': [1.5, 0.5, 1.2, 0.9, 3],'width': [0.7, 0.2, 0.15, 0.2, 1.1]},index=['python', 'C', 'C++', 'R', 'Pearl'])
print(df.hist(column="length"))

Conclusion:
In this tutorial, we learned the Python pandas DataFrame.hist() method. We learned the syntax and by applying this function on the DataFrame we solved examples and understood the DataFrame.hist() method.