To understand what is Spring Cloud Sleuth and Zipkin and why we need them in a microservices architecture where a single monolithic application is divided into smaller services, we first need to understand the problem that microservices architecture leads to, which is debugging the request flow through multiple microservices.

What is Distributed tracing?
In recent times, we have shifted from monolithic to microservices architecture due to some of the most obvious advantages of the latter over the former. One of those advantages is that in microservices architecture, we divide a large monolithic application into smaller services, each having a single responsibility that interacts with each other using lightweight protocols like HTTP.
But the microservice architecture comes at a cost. Debugging becomes challenging in the microservices architecture. A request may go through a lot of microservices in its life cycle and hence, it becomes very difficult to keep track of it: where it spent most of its time, where some error occurred, etc.
Also, suppose there are requests from multiple users, and logs are being generated in each microservice as the requests flow through them. It is very difficult to identify which logs are generated by which user’s request. Unlike this, in monolithic applications, since there's only a single application and all the processing of a request is done inside it only, its debugging is very easy by going through the generated logs and tracing the requests. To overcome this, the concept of distributed tracing comes into play.
In simple terms, it is tracing and understanding the path of a request as it flows from one microservice to another in a microservice architecture. Basically, tracing is done in an application, and distributed tracing in a distributed application.
Prerequisites: Spring Boot and Microservices.
Spring Cloud Sleuth
Spring Cloud Sleuth provides the functionality of distributed tracing in Spring microservices. It assigns a unique Id to each request which remains the same throughout the life cycle of that request as it propagates to multiple microservices. It is known as traceId.
Spring Cloud Sleuth is a library used for the purpose of distributed tracing. It automatically creates a trace corresponding to each request and as soon as it moves from one microservice to another, a new span is created.
Some Important Terminologies:
Sleuth borrows its terminologies from Dapper. Dapper is Google’s large-scale distributed systems tracing infrastructure. It is an annotation-based distributed tracing tool. It was originally created to understand the system behavior from a search request.
-
Trace: It is a collection/set of spans in a tree-like structure. There is one trace per request. Each trace is identified with a 64-bit unique ID.
-
Span: It represents a basic unit of work. It has a name and time attributes associated with it. It can also be said that it represents a single operation performed on the request within a trace. Each span is identified with a 64-bit unique ID. In addition to it, a span also consists of tags and logs.
-
Tags are key-value pairs that store information corresponding to the whole span.
-
Logs are key-value pairs that correspond to any event within that span. The initial span that starts a trace is known as the root span. The value of the span id of that span is equal to the trace id.
The diagram below shows how Spring Cloud Sleuth appends information to requests and the flow of the request.
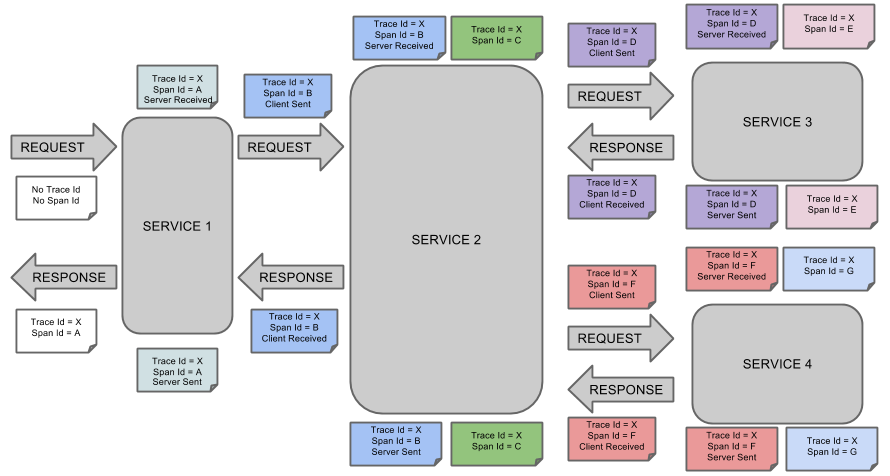
It adds application-name, traceId, spanId, and exportable into Slf4J MDC. We can see it whenever we log anything on the console. Here is an example of a log:
2020-03-29 12:33:24.829 INFO [micro1,c08a0a7dc3d1046c,c08a0a7dc3d1046c,true] 1044 --- [nio-8080-exec-2] ...
Following are the entries from the MDC:
-
appname: It represents the name of the microservice, the log belongs to.
-
traceId: It is a unique Id assigned to the request and is the same across all the microservices.
-
spanId: It is a unique Id assigned to each operation.
-
exportable: It is a boolean value and represents whether the log should be exported to Zipkin or not.
It also automatically injects and extracts trace-related information into the request's header using SpanInjector and SpanExtractor and propagates context between the services so that traceId remains the same across the services. It also provides a way to create or continue spans and add tags and logs through annotations.
Creating Microservices and Configuring Spring Cloud Sleuth
So, let's understand the usage of Spring Cloud Sleuth in our applications. We will create 3 microservices: Micro1, Micro2, and Micro3.
Microservice Micro1
Go to Spring Initializer and create a new spring boot application as described in the below snapshot. Add Spring Web dependency and click on Generate. A zip file will be downloaded, extract it. Then open your spring tool suite (STS) and click on File > Import > Maven > Existing Maven Project > Browse and open the project you extracted.

As this service will call Micro2 and Micro3 microservice and it will return the concatenated response from the two services and its own response, so we have to create a controller class, Micro1Controller as follows:
import org.springframework.beans.factory.annotation.Autowired;
import org.springframework.web.bind.annotation.RequestMapping;
import org.springframework.web.bind.annotation.RestController;
import org.springframework.web.client.RestTemplate;
import com.studytonight.micro1.service.Micro1Service;

@RestController
@RequestMapping("micro1")
public class Micro1Controller {

    @Autowired
    RestTemplate restTemplate;

    @Autowired
    Micro1Service service;

    @RequestMapping("name")
    public String getMicroserviceName()
    {
        String micro2Response = restTemplate.postForObject("http://localhost:8081/micro2/name", null, String.class);
        String micro3Response = restTemplate.postForObject("http://localhost:8082/micro3/name", null, String.class);
        return service.getMicroserviceName() + " : " + micro2Response + " : " + micro3Response;
    }
}
Now create a service class that will call the DAO(Data Access Object) class method, Micro1Service:
import org.springframework.beans.factory.annotation.Autowired;
import org.springframework.stereotype.Service;
import com.studytonight.micro1.dao.Micro1Dao;

@Service
public class Micro1Service {

    @Autowired
    Micro1Dao dao;

    public String getMicroserviceName()
    {
        return dao.getMicroserviceName();
    }
}
Now create a DAO class that returns "micro1" in response, Micro1Dao:
import org.springframework.stereotype.Repository;

@Repository
public class Micro1Dao {

    public String getMicroserviceName()
    {
        return "micro1";
    }
}
Now create a configuration class, Micro1Config:
It is important that we create the bean of RestTemplate and autowire it in the controller. Use the autowired RestTemplate instance to make a call to other microservices as Sleuth adds the trace context in the headers of the bean created and if instead, we use a new RestTemplate object every time, Sleuth will not be able to inject the trace context in the headers of the request and the traceId will be different in each microservice.
import org.springframework.context.annotation.Bean;
import org.springframework.context.annotation.Configuration;
import org.springframework.web.client.RestTemplate;

@Configuration
public class Micro1Config {

    @Bean
    public RestTemplate restTemplate()
    {
        return new RestTemplate();
    }
}
LoggingAop Class:
In order to generate logs, we are using Spring AOP. It will be used to generate logs around each method execution stating that the method has started and ended. As a prerequisite, it is already mentioned to have knowledge of the spring boot framework but still, if you are not familiar with AOP, you can go through the official documentation.
import org.aspectj.lang.ProceedingJoinPoint;
import org.aspectj.lang.annotation.Around;
import org.aspectj.lang.annotation.Aspect;
import org.aspectj.lang.annotation.Pointcut;
import org.springframework.stereotype.Component;
import lombok.extern.slf4j.Slf4j;

@Component
@Aspect
@Slf4j
public class LoggingAop {

    @Pointcut("within(com.studytonight..*)")
    public void logAllMethodsStartAndEnd()
    {

    }

    @Around("logAllMethodsStartAndEnd()")
    public Object aroundAdvice(ProceedingJoinPoint pjp) throws Throwable
    {
        log.info(pjp.getTarget().getClass().getSimpleName() + "-" + pjp.getSignature().getName() + "() start");
        Object returnValue = pjp.proceed();
        log.info(pjp.getTarget().getClass().getSimpleName() + "-" + pjp.getSignature().getName() + "() end");

        return returnValue;
    }
}
Add dependency for Sleuth in pom.xml:
In order to use Sleuth, we just need to add this dependency in the pom.xml file of our application and it will start creating spans for us. We can see tracing related info in our logs.
<dependency>
    <groupId>org.springframework.cloud</groupId>
    <artifactId>spring-cloud-starter-sleuth</artifactId>
    <version>2.1.0.RELEASE</version>
</dependency>
application.properties:
spring.application.name = micro1
Similarly, create Micro2 microservice and run it on 8081 port. Go to Spring Initializer and create a new spring boot application as described in the below snapshot. Add Spring Web dependency and click on Generate. A zip file will be downloaded, extract it. Then open your spring tool suite (STS) and click on File > Import > Maven > Existing Maven Project > Browse and open the project you extracted.
Create a controller class, Micro2Controller:
import org.springframework.beans.factory.annotation.Autowired;
import org.springframework.web.bind.annotation.RequestMapping;
import org.springframework.web.bind.annotation.RestController;

import com.studytonight.micro2.service.Micro2Service;

@RestController
@RequestMapping("micro2")
public class Micro2Controller {

    @Autowired
	Micro2Service service;

	@RequestMapping("name")
	public String getMicroserviceName()
	{
		return service.getMicroserviceName();
	}
}
Create a service class that calls the DAO class method(just like we did for microservice one), Micro2Service:
import org.springframework.beans.factory.annotation.Autowired;
import org.springframework.stereotype.Service;

import com.studytonight.micro2.dao.Micro2Dao;

@Service
public class Micro2Service {

    @Autowired
	Micro2Dao dao;

	public String getMicroserviceName()
	{
		return dao.getMicroserviceName();
	}
}
Create a DAO class that returns "micro2" in response, Micro2Dao:
import org.springframework.stereotype.Repository;

@Repository
public class Micro2Dao {

	public String getMicroserviceName()
	{
		return "micro2";
	}
}
Also, add the same LoggingAOP class in Micro2 service also.
Add dependency for Sleuth in pom.xml just like we did for microservice1. Also, add the following properties in application.properties,
spring.application.name = micro2
server.port = 8081
Following the same pattern, create another microservice Micro3 with a DAO class that returns "micro3" in response and adds the server.port property with value 8082.
Now using Postman, let's hit the endpoint of Micro1 (http://localhost:8080/micro1/name).
Logs of microservice Micro1:
2020-04-10 23:28:42.813 INFO [micro1,ac46fd64bf42414f,ac46fd64bf42414f,false] 764 --- [nio-8080-exec-1] com.rb.micro1.aop.LoggingAop : Micro1Controller-getMicroserviceName() start
2020-04-10 23:28:43.319 INFO [micro1,ac46fd64bf42414f,ac46fd64bf42414f,false] 764 --- [nio-8080-exec-1] com.rb.micro1.aop.LoggingAop : Micro1Service-getMicroserviceName() start
2020-04-10 23:28:43.321 INFO [micro1,ac46fd64bf42414f,ac46fd64bf42414f,false] 764 --- [nio-8080-exec-1] com.rb.micro1.aop.LoggingAop : Micro1Dao-getMicroserviceName() start
2020-04-10 23:28:43.324 INFO [micro1,ac46fd64bf42414f,ac46fd64bf42414f,false] 764 --- [nio-8080-exec-1] com.rb.micro1.aop.LoggingAop : Micro1Dao-getMicroserviceName() end
2020-04-10 23:28:43.324 INFO [micro1,ac46fd64bf42414f,ac46fd64bf42414f,false] 764 --- [nio-8080-exec-1] com.rb.micro1.aop.LoggingAop : Micro1Service-getMicroserviceName() end
2020-04-10 23:28:43.324 INFO [micro1,ac46fd64bf42414f,ac46fd64bf42414f,false] 764 --- [nio-8080-exec-1] com.rb.micro1.aop.LoggingAop : Micro1Controller-getMicroserviceName() end
Logs of microservice Micro2:
2020-04-10 23:28:43.017 INFO [micro2,ac46fd64bf42414f,253be4e71d8cb3e7,false] 6048 --- [nio-8081-exec-1] com.rb.micro2.aop.LoggingAop : Micro2Controller-getMicroserviceName() start
2020-04-10 23:28:43.021 INFO [micro2,ac46fd64bf42414f,253be4e71d8cb3e7,false] 6048 --- [nio-8081-exec-1] com.rb.micro2.aop.LoggingAop : Micro2Service-getMicroserviceName() start
2020-04-10 23:28:43.024 INFO [micro2,ac46fd64bf42414f,253be4e71d8cb3e7,false] 6048 --- [nio-8081-exec-1] com.rb.micro2.aop.LoggingAop : Micro2Dao-getMicroserviceName() start
2020-04-10 23:28:43.026 INFO [micro2,ac46fd64bf42414f,253be4e71d8cb3e7,false] 6048 --- [nio-8081-exec-1] com.rb.micro2.aop.LoggingAop : Micro2Dao-getMicroserviceName() end
2020-04-10 23:28:43.026 INFO [micro2,ac46fd64bf42414f,253be4e71d8cb3e7,false] 6048 --- [nio-8081-exec-1] com.rb.micro2.aop.LoggingAop : Micro2Service-getMicroserviceName() end
2020-04-10 23:28:43.026 INFO [micro2,ac46fd64bf42414f,253be4e71d8cb3e7,false] 6048 --- [nio-8081-exec-1] com.rb.micro2.aop.LoggingAop : Micro2Controller-getMicroserviceName() end
Logs of microservice Micro3:
2020-04-10 23:28:43.293 INFO [micro3,ac46fd64bf42414f,dfeb0af54c8faee5,false] 18824 --- [nio-8082-exec-1] com.rb.micro3.aop.LoggingAop : Micro3Controller-getMicroserviceName() start
2020-04-10 23:28:43.296 INFO [micro3,ac46fd64bf42414f,dfeb0af54c8faee5,false] 18824 --- [nio-8082-exec-1] com.rb.micro3.aop.LoggingAop : Micro3Service-getMicroserviceName() start
2020-04-10 23:28:43.298 INFO [micro3,ac46fd64bf42414f,dfeb0af54c8faee5,false] 18824 --- [nio-8082-exec-1] com.rb.micro3.aop.LoggingAop : Micro3Dao-getMicroserviceName() start
2020-04-10 23:28:43.301 INFO [micro3,ac46fd64bf42414f,dfeb0af54c8faee5,false] 18824 --- [nio-8082-exec-1] com.rb.micro3.aop.LoggingAop : Micro3Dao-getMicroserviceName() end
2020-04-10 23:28:43.301 INFO [micro3,ac46fd64bf42414f,dfeb0af54c8faee5,false] 18824 --- [nio-8082-exec-1] com.rb.micro3.aop.LoggingAop : Micro3Service-getMicroserviceName() end
2020-04-10 23:28:43.301 INFO [micro3,ac46fd64bf42414f,dfeb0af54c8faee5,false] 18824 --- [nio-8082-exec-1] com.rb.micro3.aop.LoggingAop : Micro3Controller-getMicroserviceName() end
We can see in the logs, the traceId is the same in each microservice but a new spanId is being generated for each microservice. Also, the "exportable" part of the logs is false because we are not yet exporting the logs to Zipkin.
Using Zipkin
It is a distributed tracing system that provides a UI to see the traces and also allows to search of traces using the traceId. It also shows the dependency graph of our microservices. Let's see how we can configure our microservices to export logs to Zipkin. By default, it uses in-memory storage for storing traces so as soon as we close it, the data will be lost.
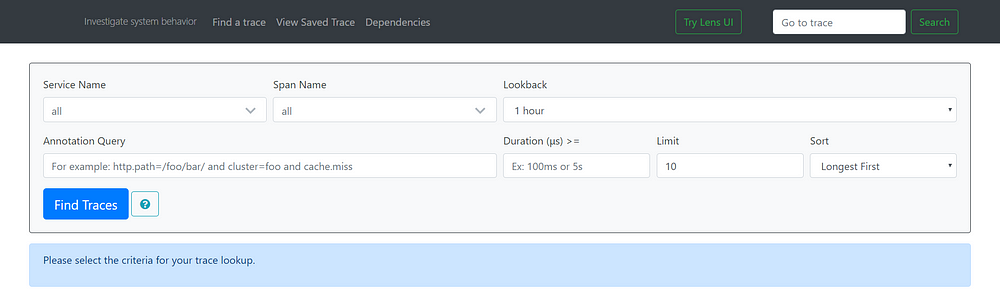
Firstly, download Zipkin's jar file from the internet. Double-click in order to run it. Go to localhost:9411 which is the default port of Zipkin, you can see the Zipkin UI.
Now add the following dependency in each microservice's pom.xml.
<dependency>
    <groupId>org.springframework.cloud</groupId>
    <artifactId>spring-cloud-starter-zipkin</artifactId>
    <version>2.2.0.RELEASE</version>
</dependency>
Now again try running the microservices. Do you see any traces in Zipkin? I guess no. See the logs, exportable is still false. By default Spring Cloud Sleuth sets all spans to non-exportable. That means that traces appear in logs but not in any remote store. There's a property that we need to configure in the application.properties of our microservices: spring.sleuth.sampler.probability or spring.sleuth.sampler.percentage in previous versions whose values can be from 0.0 to 1.0 representing how much percentage of spans must be exported.
Let’s add this property in each microservice's application.properties file:
spring.sleuth.sampler.probability = 1.0
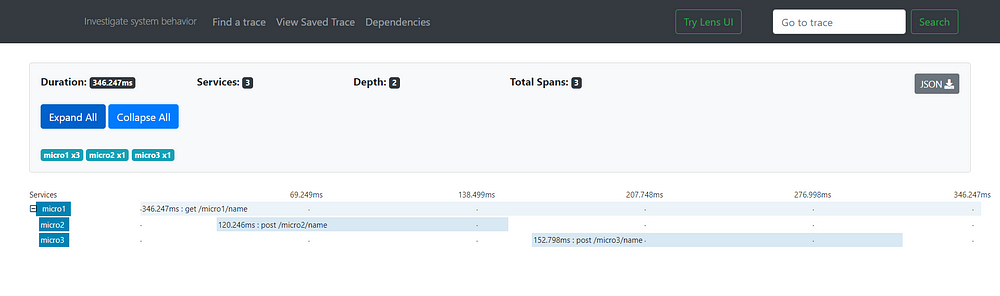
Now, we can see a trace on Zipkin. You can explore it.
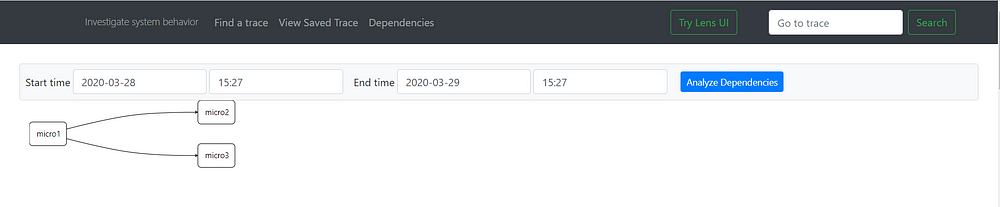
Also, the dependency graph:
We can also configure Zipkin's base URL if it is not running on the default port. Put this in the application.properties of our microservices:
spring.zipkin.baseUrl: https://192.168.99.100:9411/
Conclusion
So in this tutorial, we understood how we can use Spring Cloud Sleuth with Java Microservices to trace request flow using logs and how to use Zipkin to visualize the flow of requests in a distributed system.
Frequently Asked Questions(FAQs)
What is request tracing in microservices?
Request tracing in microservices refers to the process of capturing and following the flow of requests as they traverse through various services within a distributed system. It allows you to gain insights into how requests are processed, identify performance bottlenecks, and diagnose issues across service boundaries.
What is Spring Cloud Sleuth, and how does it facilitate request tracing?
Spring Cloud Sleuth is a distributed tracing solution that seamlessly integrates with Spring Boot and Spring Cloud applications. It provides unique trace IDs for each request, allowing you to trace the journey of a request across multiple microservices. It captures essential information, such as timing data, and enhances observability and troubleshooting capabilities.
What is Zipkin, and how does it complement Spring Cloud Sleuth?
Zipkin is an open-source distributed tracing system that works harmoniously with Spring Cloud Sleuth. It aggregates and visualizes tracing data, enabling you to analyze the performance and dependencies of your microservices. Zipkin provides a user-friendly interface to explore and understand the flow of requests, aiding in performance optimization and troubleshooting.
How can I integrate Spring Cloud Sleuth and Zipkin into my microservices architecture?
Integrating Spring Cloud Sleuth and Zipkin is relatively straightforward. By including the necessary dependencies in your microservices' Maven or Gradle configuration, Spring Cloud Sleuth automatically instruments your services and assigns trace IDs to requests. Zipkin can be deployed as a standalone server or as a Docker container, allowing you to configure your microservices to send tracing data to Zipkin.
Can I use Spring Cloud Sleuth and Zipkin with non-Spring microservices?
While Spring Cloud Sleuth is primarily designed for Spring-based microservices, it is also compatible with non-Spring microservices. By manually adding trace IDs to requests and configuring your non-Spring microservices to send tracing data to Zipkin, you can still achieve request tracing across your entire distributed system.
You may also like: