If you use Linux servers to conduct performance tests then it is very crucial to monitor the resource usage of the Linux server so that you can decide when to add a new Linux server or may be use a better Linux server to increase the performance. Because once the CPU usage crosses 80% usage, the Linux server cannot do much.
Traditionally, we have used the top command to check the CPU and memory usage for Linux machines, but to get more detailed insights, we should use nmon tool to monitor the Linux servers.
In this article, we will learn how to install nmon on your Linux server and then we will cover all the major commands which can be used to get various metrics to monitor the Linux server.
What is nmon?
Nigel's Performance Monitor or nmon is a simple-to-use monitoring tool for Linux servers which can help you understand what is going on within your Linux server. As per the official website of this tool, this tool has been downloaded more that 1 million times till 5th September 2020.
Using nmon tool, you can screen the performance data of your Linux server directly on the terminal screen which is refreshed every second just like the top command. But unlike top command, nmon shows a lot more information.
With nmon, we can easily take out performance data in form of zip file and then we can use other related tools to analyse and visualize the data. Following are some of the tools:
nmonchart: This can be used to generate graphs. We can directly use the nmon output file and generate a webpage file (with .html extension), which can be directly opened in web browser.
nmon Analyser Excel Spread-sheet: This tool can be used to create Microsoft Excel spreadsheets and graphs. If you do not like working with Excel sheets, then this tool is not for you.
nmon2rrd: This tool usses the rrd tool to generate graphs and web pages using the nmon output file.
NOTE: If you think nmon is just another tool, then you should know that it was an internal project at IBM, where it was used for many years before making it open source in July 2009.
Installing nmon:
Installing nmon tool is very easy on any flavour of Linux.
If you are working with a Linux distribution like Debian, Ubuntu, etc. which use apt, then you can run the following commands to install nmon tool:
First we should update our apt-get tool:
sudo apt-get update
Then to install nmon, run the following command:
sudo apt-get install nmon
If you use linux distribution like Redhat, Fedora, CentOS, etc., which use dnf then run the following commands:
dnf install epel-release
# to install nmon
dnf install nmon
Using nmon to monitor Linux Server
Now let's see how we can use the nmon tool to monitor our Linux servers.
1. Run nmon tool
To run the nmon tool, simply type in nmon and hit the Enter key to see the nmon tool interface on your terminal.
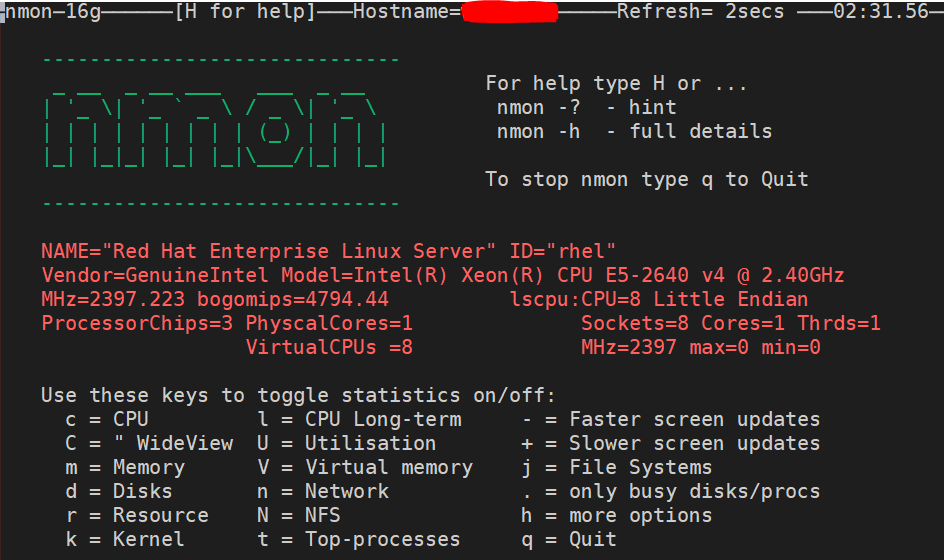
As you can see in the above snapshot, to view different statistics, all you have to do is press the specific key for any statisctics and that will get added to the nmon tool interface.
2. See CPU utilization
Press the c key to start seeing the CPU utilization.

3. See Memory and Disk usage
Now if you want to monitor the memory and disk usage too along with the CPU usage, you just have to press the m key to add Memory usage stats.

Then press d key for including the disk usage stats.

Similarly, as you can see in the first default snapshot of the nmon tool, there are so many different type of statistics that you can see just by pressing the right key.
4. Remove any Statistic
If you wan to remove any added statistics from the nmon tool view, press the key again (that you used to include the stats), for example, to remove memory stats, I can press the m key again, or the d key to remove disk usage stats.
5. Update the Refresh rate
Whenever you run the nmon tool, you will see the refresh rate specified at the top, along with the hostname and time information. By default it is 2 seconds, but we can increase or decrease it by pressing the + or the - keyboard key.
6. Collecting data from nmon tool
To collect data using the nmon tool, so that you can analyse it later, we can run the following command:
nmon -f -s 60 -c 20
where, 60 represents the duration for which new data will be collected and 20 represents that 20 rounds of data will be collected for 20 consecutive 60 second intervals. Similarly, if you run want to analyse a Linux server for the next 1 hour, and you want to collect data every 1 minute, then use the following command:
nmon -f -s 60 -c 60
The above command means, 60 data sets will be collected, one every 60 seconds(1 minute).
When the above command runs, you will find a file with extension .nmon created in the same directory with all the data dump in it.
Conclusion:
The nmon tool is a one-stop solution for monitoring Linux servers which includes a lot of different types of information and statistics which is generally provided by 5-6 tools combined. It's easy to install and simple to use, what more do you want.
You may also like: